
Dashboard Screen
 |
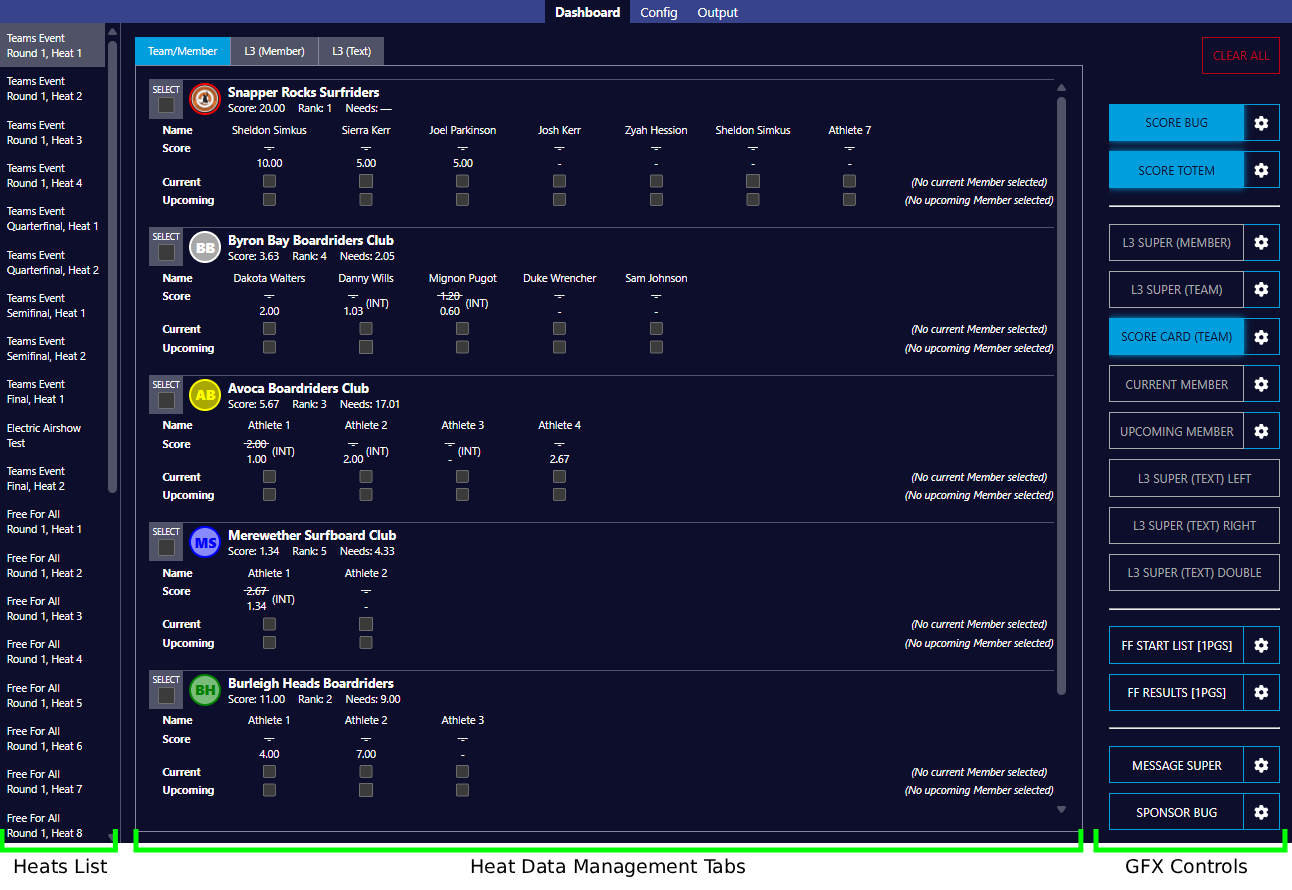 |
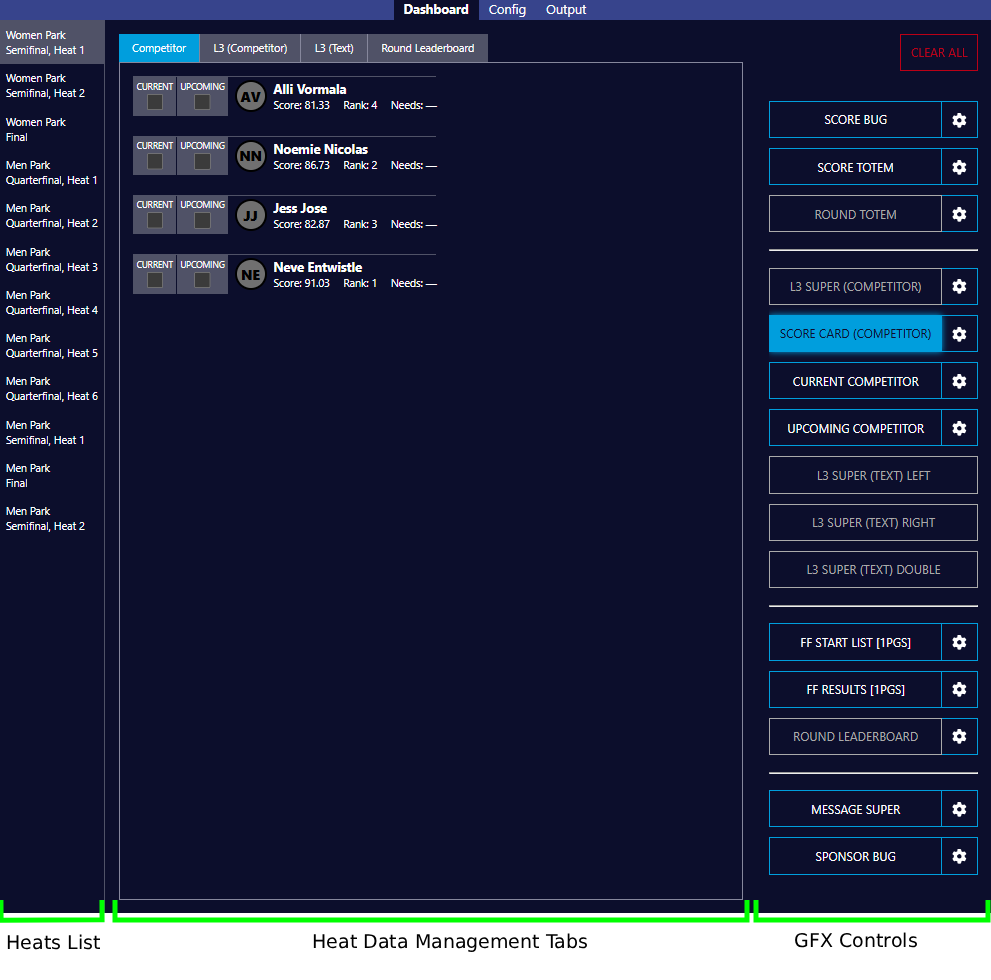
| Fig 1 - Individual Event View | Fig 2 - Team Event View |
Heats List
- Lists your Event’s Heat data, as per your Live Heats dashboard
- All data changes made within Live Heats will be reflected here
- Requires a Draw to be produced and scheduled before it will appear within the GFX system
Heat Data Management Tabs
Individual Event (fig 1)
-
Competitor Tab
-
Here you can view the Competitors list for the selected Heat
-
This data reflects your Live Heats data
-
From here you can select your Current and Upcoming Competitors in order to trigger those related graphics
-
-
L3 (competitor) Tab
-
As per the Competitor Tab, here you can view the Competitors list for the selected Heat
-
This view allows you to select a Competitor in order to trigger those related graphics
-
Teams Event (fig 2)
-
Team/Member Tab
-
Here you can view the Teams and Team Members list for the selected Heat
-
This data reflects your Live Heats data
-
From here you can select a Team and Current/Upcoming Team Members in order to trigger related graphics
-
-
L3 (Member) Tab
-
As per the Team/Member Tab, here you can view the Teams and Team Members list for the selected Heat
-
From here you can select a Team Member in order to trigger those related graphics
-
All Event Types
-
L3 (text) Tab
-
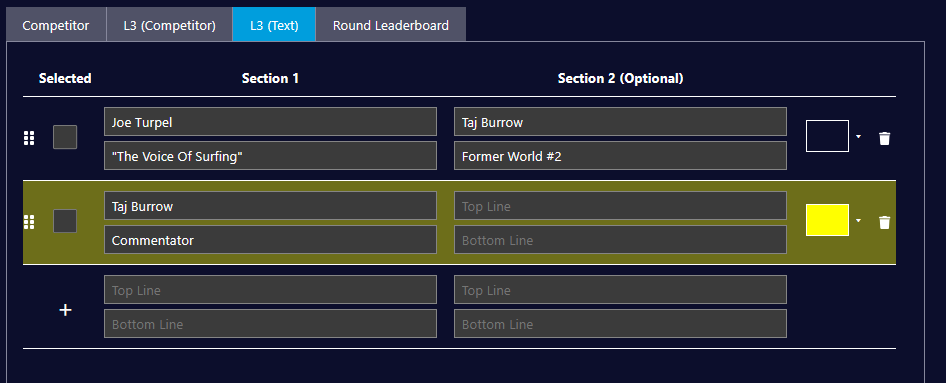
This form allows you to create any number of one or two name super graphics, with optional second lines of text
-
To add a new super, enter the required info in the form at the bottom of the stack and then click the “+” icon
-
Entries in the stack can be color coded to allow easy grouping and identification using the color picker tool on the right of the item row
-
-
-
Entries can also be reordered via drag and drop using the grab icon on the left of the item row
-
Entries can be deleted using the Trash Can icon on the right of the item row
-
-
Round Leaderboard Tab
-
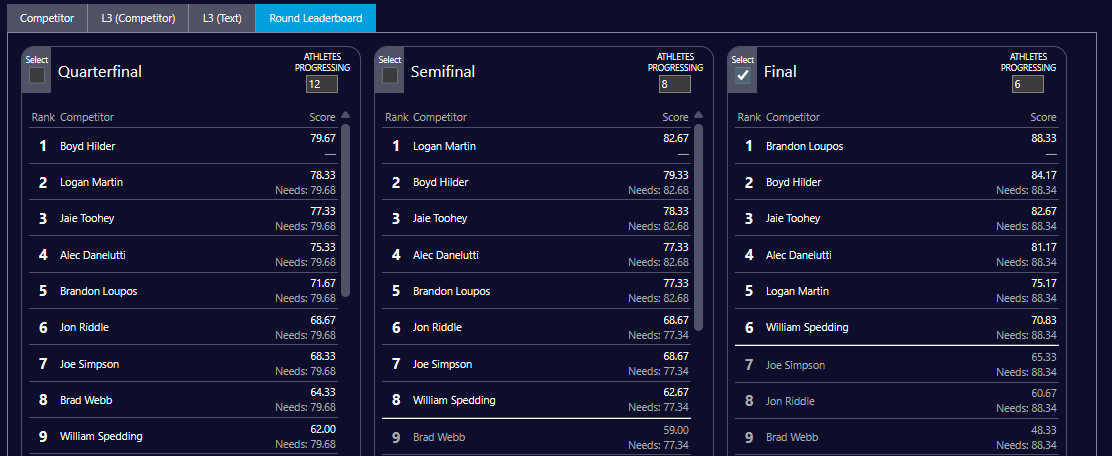
Here you can view the Round Leaderboards for Live Heats events that are set up to have progression determined by Round placings as opposed to Heats
-
This setting is controlled within the Live Heats system
-
-
-
Selecting a leaderboard on this screen will allow you to trigger related graphics
-
Additionally, you are able to add a “progression cutoff” line to your Round Leaderboard by adding the number of athletes progressing for each round. Leaving this blank will remove the cutoff indicator for that particular round.
-
A global setting for the Cutoff Indicator is available within the Round Leaderboard button config menu within the GFX Control List.
-
GFX Control List
-
These are your GFX trigger buttons
-
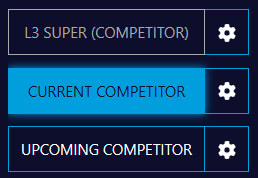
Standard button states are as follows:
 |
|
|
|
|
-
If a graphic has configuration options available, a cog icon will appear next to the button as per the above examples.
-
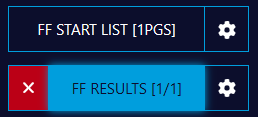
For graphics components that offer pagination, details of the number of pages will appear on the button
-
To page through a multi-page component, simply press the blue button repeatedly.
-
-
The progress counter will update accordingly
-
-
To close the component, simply click the red cross button
-
Alternatively, the component will close once you have stepped through all pages and clicked the blue button again